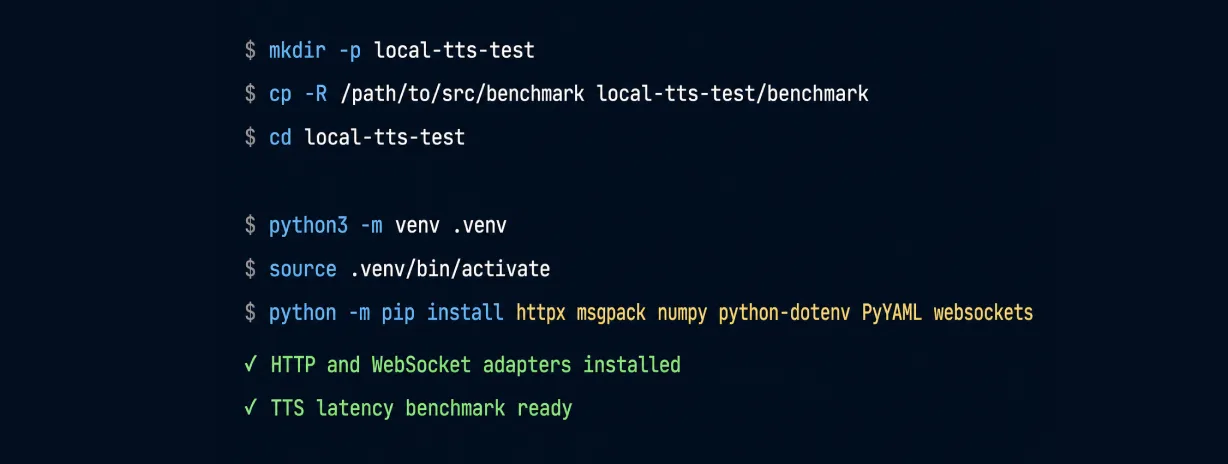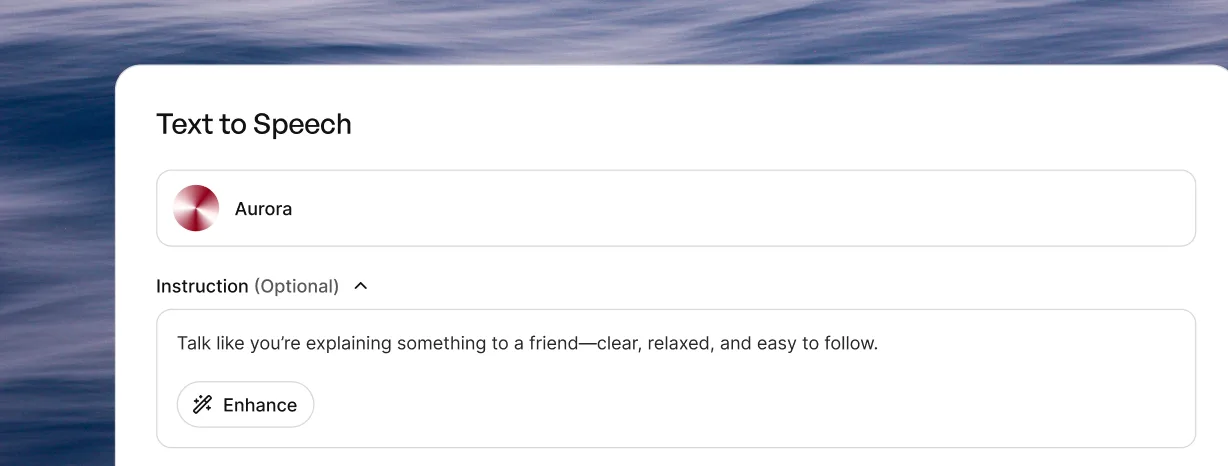
TTS LATENCY BENCHMARK
How fast can TTS models start speaking?
An open benchmark measuring end-to-end time to first audio across TTS providers, protocols, and three US client regions.
LEADERBOARD
TTS Latency Leaderboard
| Provider | Protocol | TTFB p50 | TTFA p50 | TTFA p95 |
|---|---|---|---|---|
| Breeze TTS 2 | WS persistent | 119.4 ms | 133.6 ms | 163.3 ms |
| ElevenLabs Flash v2.5 | WS persistent | 134.8 ms | 154.5 ms | 207.6 ms |
| Fish Audio S2.1 Pro | HTTP warm pool | 173.6 ms | 175.3 ms | 271.4 ms |
| Inworld TTS-2 | WS persistent | 163.1 ms | 189.4 ms | 220.4 ms |
| Cartesia Sonic 3.5 | WS persistent | 106.8 ms | 241.9 ms | 344.2 ms |
| xAI TTS | WS persistent | 249.1 ms | 318.3 ms | 361.1 ms |
| Speechify Simba 3.2 | HTTP warm pool | 374.5 ms | 379.0 ms | 424.5 ms |
| Async Flash 1.5 | WS persistent | 247.0 ms | 438.1 ms | 479.6 ms |
| ElevenLabs v3 | HTTP warm pool | 544.0 ms | 628.7 ms | 917.9 ms |
METRICS
Measuring every millisecond before speech begins.
Three complementary metrics separate transport time from silence in the returned audio, showing when a provider responds and when the listener actually hears speech.

Time to First Byte
Measures the time from request start to the first audio chunk received by the client. Control messages and acknowledgements do not count.

Initial Silence
Measures the decoded audio between the beginning of the returned stream and the first detected voice onset. This reveals models that return audio quickly but delay audible speech.

Time to First Audio
Measures the time from request start to the first audible speech available to the client. It combines delivery time with the leading silence in the returned audio.
METHODOLOGY
40 prompts. 3 US regions. One consistent methodology.
We measure client-side TTS startup latency using the same 40 English prompts for every provider. Requests run serially from US West, US Central, and US East. When both WebSocket and HTTP are available, the benchmark reports the faster protocol for that provider.
40
Fixed English prompts
3
US client regions
3
Warm-ups per regional client
How measurements are collected
Prepare each provider
WebSocket and HTTP are compared when both are available, and the lower-latency protocol is used for reporting. Persistent connections and HTTP connection pools are established in advance. Each regional client then completes three warm-up requests, which are excluded from timing.
Run a controlled workload
Every provider receives the same 40 prompts. The prompts are the 40 longest entries in Seed-TTS-Eval, creating a more production-representative workload than short test phrases.
Pool and summarize
Successful samples from all three regions are pooled to calculate p50 and p95.
Testing conditions: Breeze TTS 2 was tested using its highest request priority. All other providers were tested on paid plans.
RESOURCES